Recommended for General English


 👨 OL GAMPAHA ZONE 2 TERM 2022


According to the details given in the chart the majority of the children like to play cricket. It stands at 35%. The least percentage of the children like to play hockey. Only 5% of the children like to play hockey. However, an equal percentage of the children like to play volleyball and football. It is 15% each. According to the chart more children like to play chess than hockey. 10% of the children like to play chess while only 5% of them like hockey.

FOR MORE GRAPHS AND OTHER ACTIVITIES

................................................................................................................................................................
Grade 11: Gampaha (Zonal) Second Term Test Paper 2017

The above given pie charts show how the students of Grade 11 classes of Wasantha Vidyalaya select aesthetic subjects. The pie charts represent separately how boys and girls favour different aesthetic subjects. There are four aesthetic subjects. They are Drama, Music, Dancing and Drawing.
According to the details given in the pie charts the highest percentage of the boys like drawing. It stands at 40%. The most popular aesthetic subject among the girls is Dancing. It is as as high as 60%. However, Dancing is the least popular aesthetic subject among the boys. It stands as low as 10%. The percentage difference for dancing between girls and boys is as high as 50%. Interestingly, an equal percentage of girls like Drawing and Drama. It is 10% each. According to the pie charts more boys like Drama than girls. 30% of the boys and 10% of the girls like Drama. Music is equally popular among both girls and boys.
Targeted Papers for OL


 The Venn diagram given here shows three games a group of students of grade 11 C class of Jayampathy Vidyalaya like to play. The three games are cricket , chess and carrom. There are 32 students.


 The table given here represents the countries where 125 students of Ranpokunagama Maha Vidyalaya like to study after their A/L Examination. The names of six countries they like to study are directly mentioned in the table. The 7th row represents the other countries.


 💓💓💓💓
💓💓💓💓

The above 👆 module contains all types of test activities for Question - 6 of the OL English paper. It can easily be used as a handbook for classroom teaching or as a self-study guide.


 The table given above represents the funds allocated for the year 2019 for several development projects of Ranpokunagama Maha Vidyalaya by the Past Pupils' Association. They selected 5 projects for 2019 and allocated a total amount of 6.2 million rupees.
OL BOOKS PACK OVERVIEW


The table given above depicts the percentage of applications received last year for AL admissions in Ranpokunagama College based on gender. The table has three columns. The first column represents the streams while the second and third columns represent the percentages of the boys and the girls respectively. 


The test on graphs carries 10 marks at the OL exam ( Sri Lanka). Describing graphs has also been included in the General English paper.
My objective here is not to teach you how to write descriptions of graphs ; yet to help you form an idea as to how a description is written. By going through the following descriptions, you will probably be able to form an idea as to how a description on a graph is written. However, you need constant practice as a student, so find some more activities and keep on writing. It will enable you to produce a sound description.
Sajendra Kumara
👉
It may take several hours or sometimes even a few days for granting access to the papers you request to download. I kindly request you to bear with the delay. Don't give up hopes. Check your e-mails for permission.
මෙම blog page එකේ ඔබට ලබාදෙන papers , download කරන්න access ලබාගැනීමට ඇතැම් විට පැය කීපයක් හෝ දින කීපයක් උවද ප්රමාද වියහැකි බව සලකන්න . ❤ Sajendra Kumara whatsApp/call:0777597875
💕
👉Access ලබාදීමට යම් කාලයක් ගතවනු ඇත
Dear students and friends ,
If you have an urgent need to download the materials published here simply leave me a message on whatsApp . 👉0777597875
ඔබට ඉතා ඉක්මනින්ම මෙහි ඇති materials භාගත කිරීමට පහත අන්කයට whatsApp message එකක් යොමු කරන්න .
0777597875
Sajendra Kumara
👉 A collection of Graphs Activities for OL
👉 OL English Unit Wise Activities: (new)
👉Writing Dialogues For OL: Way To Win (new)
👉 Writing stories for OL: Way to Win (new)
👉 OL English Paper 2023(2024) Paper - 1
OL English Paper 2023(2024) Paper - 2
OL English Paper 2023(2024) marking scheme
OL paper 2023(24) paper 1 discussion
✊👲
A diagnostic English paper for OL classroom
👊👊
Western Province 2023 ( 2024) OL Result Enhancement Book, Sapelata Saviyak (සා.පෙළට සවියක්). All papers included.
👉 Model Double Bar Graph Activity paper OL
(Model Answer Included) 👇
👉OL English Paper 2022(2023) Paper 1👇
OL English Paper 2022(2023) Paper 2👇
OL English Marking Scheme 2022(2023)
👉Assessment Worksheet on Graphs (OL & Grade 10)👇
👉Way to Win Part 10 : Describing Venn Diagrams (2022) 👇👇

👉Western Province OL results enhancement papers 2022 (2023) for all the subjects. Free download here.
Send request on WhatsApp for early access
Way to Win :Describing a table for OL
👉 Way to Win : Describing Pie Charts for (OL)
Describing Pie Charts for OL (FREE )
Model Answer Sheet 👇
👉👊Way to Win: Describing Bar Graphs (OL)
Western Province OL results enhancement 2023
Describing Bar Graphs OL (FREE)
👉 FOR MODEL ANSWERS SEE BELOW
Useful Idioms: Bilingual presentation
👌 Way to Win: Writing Formal Letters
western province OL results enhancement 2023
👍Way to Win: Writing Informal letters for OL
Western Province OL Results Enhancement 2023
👉👊Way to Win: Writing Paragraphs for OL
Western Province OL Results Enhancement 2023
👉👧 Western Province OL Results Enhancement 2023
Writing Invitations pdf
👉 Model Answer Sheet for Invitations (pdf)
prepared by Sajendra Kumara 👇
👉 Western Province OL RESULTS ENHACEMENT PROGRAMME 2023
Writing Notices Worksheet Pdf
👉 Western Province OL results Enhancement Programme 2023
Writing Personal Notes worksheet Pdf

The contents of the Graphs book👇


Paper - 2
👦OL GAMPAHA ZONE 2 TERM 2022
Paper - 1
Sajendra Kumara Video Channel
SK VIDEO (Pls. Subscribe)
👉👊Best idioms for you: With Sajendra
👍WP OL PRACTICE PAPER 2022

👉
Request on WhatsApp for OL Marking Schemes
👧👧
For General English Activities and resources
Visit: 👇
👨👨Watch Video


The above given pie chart shows the results of a survey conducted at Rathgama Maha Vidyalaya on what children like to play in their free time. There are six games included in the pie chart. They are cricket, Elle, Volleyball , football, hockey and chess.
According to the details given in the chart the majority of the children like to play cricket. It stands at 35%. The least percentage of the children like to play hockey. Only 5% of the children like to play hockey. However, an equal percentage of the children like to play volleyball and football. It is 15% each. According to the chart more children like to play chess than hockey. 10% of the children like to play chess while only 5% of them like hockey.
As a whole I can say that cricket is the most favourite game among the children. Most children do not like to play hockey.
👇 click here
👉 Note: Pay attention to the highlighted words and phrases.
👩You can use the following Words and phrases in describing a graph.
*according to the details given in this graph....
*Only a few .......
* An equal number of ......
*More .........than...
*As a percentage it stands at....
* The majority ....
*The least number of ....
*The highest number of ..... percentage of....
*minimum / maximum
Note
Use the following format when you describe a graph.
Paragraph 1: The introduction
Paragraph 2: The description
Paragraph 3: The opinion.
👉👉 Watch video presentation by Sajendra
Sajendra Kumara

The Best Guide to OL

................................................................................................................................................................
Grade 11: Gampaha (Zonal) Second Term Test Paper 2017

According to the details given in the pie charts the highest percentage of the boys like drawing. It stands at 40%. The most popular aesthetic subject among the girls is Dancing. It is as as high as 60%. However, Dancing is the least popular aesthetic subject among the boys. It stands as low as 10%. The percentage difference for dancing between girls and boys is as high as 50%. Interestingly, an equal percentage of girls like Drawing and Drama. It is 10% each. According to the pie charts more boys like Drama than girls. 30% of the boys and 10% of the girls like Drama. Music is equally popular among both girls and boys.
As a whole , I find that though Drawing is the most popular aesthetic subject among the boys it is one of the least popular aesthetic subjects among the girls.
Sajendra Kumara
Sajendra Kumara
Targeted Papers for OL


How to find the object: video
Activity: 3
The following graph shows how the Lions Club of Ganemulla has allocated money in percentage under different projects. Study the graph and write a description about how the money was distributed. Use around 100 words.
Year End/ Western Province Grade 11 2015

The above given graph shows how the Lions Club of Ganemulla has allocated money in percentage under different projects. There are six projects.
According to the details given in the graph the Lions Club has allocated the highest amount of the money for Elders Homes. It stands as high as 30%. On the other hand the least percentage of money has been allocated for Drugs and Medical Equipment. It is only 5%. The two projects on Spectacles and Hearing Aids and Disaster relief have been allocated an equal percentage of the money. It stands at 20% each. The club has planned to spend more on Health camps than both Drugs and Medical Equipment and Other Relief Work.
According to the graph, it is clearly seen, the Lions Club of Ganemulla pays much attention on Elders' Homes than other projects.
👋
OL BOOKS PACK OVERVIEW
READ HERE👇👱


👉The contents of the Graphs book

Model Graph activity for OL
Activity: 4
The following bar graph shows the preference of a group of students for an educational tour. Write a description of the graph. Use around 100 words.
1. The Hill country 2. The Yala National Park 3. Colombo
4. The Museum 5. The Hambanthota Harbour 6. The Sigiriya


 Venn Diagrams for OL
The following bar graph shows the preference of a group of students for an educational tour. Write a description of the graph. Use around 100 words.
1. The Hill country 2. The Yala National Park 3. Colombo
4. The Museum 5. The Hambanthota Harbour 6. The Sigiriya

The graph given here represents the preference of a group of students for visiting different places in the country. There are six places included in the graph. They are The Hill country , The Yala National Park , Colombo , The Museum , The Hambanthota Harbour and The Sigiriya.
According to the details given the graph the highest number of students prefer to visit Colombo. 12 students like to visit Colombo. The least preferred place among the students is the Hill Country. However, an equal number of students like to visit The Yala National Park and The Museum. More children like to visit The Hambanthota Harbour than the Sigiriya.
In a nutshell, I can say that Colombo is the most preferred place among the students.
Sajendra Kumara
👇 CLICK HERE👇
Download free pdf👇👇
OL Essay video

Activity:5
The following Pie-chart tells you about what students in your class use the internet for. Write a description based on the information given. Use about 100 words.
These words may help you:
majority , minority , some , many , highest
[ Grade 11 -2019 Year End WP]

The above given pie-chart shows what the students in Grade 11 A use the internet for. According to the chart the students use the internet for five purposes. They are education , online ordering , communication , information and entertainment.
According to the details given in the pie chart the majority of the students use the internet for entertainment. As a percentage it stands at 35%. On the other hand only 10% of the students use the internet for online ordering. 27% of the students use the internet for education. That is the second highest percentage. More students use the internet for communication than information. It is 15% and 14% respectively.
By analyzing the details given in the pie chart one can find that internet is the most favourite source of information among the students.


Activity: 6
Second Term Test North Western Province-2019

The Venn diagram given here shows three different games played by 30 boys of grade 11B. The games are cricket , volleyball and hockey.
According to the details given in the Venn diagram 15 students play volleyball only. Eight students play cricket only while three students play hockey only. According to the diagram four students play cricket and volleyball only. There aren't any students who play all the three games.
As a whole, I can clearly find that volleyball is the most favourite game among the students.
👦👦👦👧
Enjoy the experience of a web novel by the young Sri Lankan writer Ruchi Tarin. Simply click the image👇
👇Click here 👇
Activity: Venn Diagrams 7
The following Venn diagram shows three games a group of students of grade 11 C class of Jayampathy Vidyalaya like to play in their free time. Study the graph and write a passage. Use around 100 words.
[ Steps to Brilliance Activity Book - 01 for OL students by Sajendra Kumara ]

According to the Venn Diagram the highest number of the students like to play cricket. Five students like to play chess only. Seven students prefer carrom only. Four students like to play both chess and carrom only. Three students like to play both carrom and cricket only. Only one student likes to play all the three games.
As a whole, I can find that cricket is the most favourite game among the students. The least favourite game among the students is chess.
Compound nouns: video
Activity 7: O/L 2018

This bar graph shows the choice of the subjects of Grade 11 students in a school for Advanced Level streams. The survey was conducted among 100 students. The vertical axis represents the number of students while the horizontal axis represents the subject streams. There are six subject streams.
According to the details given in the bar graph the highest number of the students like to choose Biology. It is 30 students. The lowest number of students like music. Only 10 children like music. An equal number of students like to choose IT and Accounting. More children like Art than Maths.
As a whole I can find the most favourite subject among the students is Biology and the least favourite subject is Music.
(Sajendra Kumara)
👉updated

👉Grammar Activities for School👇
Activity 8: O/L 2017

According to the table the highest number of the students like to study in America. As a percentage it stands at 24%. The lowest number of students like to study in countries other than those mentioned in the table. As a percentage it stands at 5.6%. An equal number of students, 10 each , like to study in India and Russia respectively. According to the table, more students like to study in England than in Japan.
As a whole, I can find that the most favourite country among the students for studying after A/L is America. The second most favourite country among the students is England.
(Sajendra Kumara)


Sajendra's Video Channel
👉👉SK VIDEO
Activity 9: Q:Western province practice activity book

The bar graph given here represents the number of dengue victims found at Kaluthara in the year 2015. The horizontal axis represents the months and the vertical axis represents the number of dengue patients.
According to the graph the highest number of dengue patients were reported in May. It was as high as 700. The lowest number of the patients were reported in December. An equal number of the patients were found in January and in November. The number of patients found from Kaluthara were higher from May to August than all the other months.
I can find that there was a decrease in the cases found from June to November. There was a sharp in crease in the number of dengue patients after April in 2015. It was an alarming increase of 500 patients. However, there was a gradual drop of cases after May. (Sajendra Kumara)
Enjoy the experience of of a Web Novel by the young Sri Lankan writer Ruchi Tarin. Simply click the image below. 👇
Describe A Venn Diagram

The above 👆 module contains all types of test activities for Question - 6 of the OL English paper. It can easily be used as a handbook for classroom teaching or as a self-study guide.
Activity 10: Q(W/P practice activity book)

The bar graph given above shows the attendance of students in grade 11 A in the previous week. The vertical axis represents the number of students while the horizontal axis represents the five school days.
According to the table 40 students were present on Monday. The lowest number of 20 were present on Friday. An equal number of students were present on Tuesday and Thursday. According to the graph more students were present on Wednesday than on Friday.
As a whole, I can see that the attendance was satisfactory on Monday than all the other days. (Sajendra Kumara)
 |

Activity 11: Model Table for OL

According to the details given in the table, the Past Pupils' Association allocated the highest amount of funds for developing sports facilities. It was 4 million rupees. They allocated an equal amount of funds for installing a CCTV camera system and constructing a shrine room. It was 0.5 million rupees each. The Association allocated more funds for purchasing books for the library than colour washing the parapet wall. They allocated the least amount for colour washing the parapet wall.
In a nutshell, I can say that the Past Pupils' Association was more interested in developing sports facilities than other projects.


READ HERE👇
Activity 12:


The graph given above represents how the Village Development Society of Attanagalla has planned to spend funds for a few projects next year. They have planned five projects. The vertical axis represents the amount of funds they are going to spend and the horizontal axis represents the projects.
According to the details given in the graph the Village Development Society is going to spend the highest amount for the construction of a bridge. It is 25 million rupees. They are going to spend the lowest amount for the dengue eradication programme. It stands at 5 million rupees. They will spend an equal amount of funds for the development of the children's park and for purchasing books for the public library. It is 10 million rupees each. They have planned to spend more funds for the construction of the village tank than to the dengue breeding project.
In a nutshell , I can say that the Village Development Society of Attanagalla is more interested in the construction of a bridge for the village than all other projects.
Sajendra
👉👉👉Visit the Kingdom Panduwasnuwara👉Grammar Activities 👇

Activity 13: Model Table Description for OL

According to the details given in the table the highest percentage of the boys applied for Physical Science. It was 40%. Interestingly, an equal highest percentage of girls applied for Biology. An equal percentage of the boys applied for both Commerce and Technology last year. It stood at 20% each. More girls applied for Arts than boys.
As a whole I can clearly find that the girls were least interested in applying for Technology while the boys were least interested in applying for Arts stream subjects.


The bar graph given above represents the leisure activities of students of the Southern Province. The vertical axis represents the percentage of the students. The horizontal axis represents the leisure activities. There are four leisure activities. They are Chess , Tennis , Swimming and Cycling.
 The pie chart given above represents different leisure time activities a group of students engage in during their leisure time. There are five leisure time activities. They are watching TV , playing games , browsing the internet , reading story books and gardening.

 15) Model bar graph activity
The bar chart given above depicts the attendance of school of Grade 11 C students of Minidu Vidyalaya in one week last month. The vertical axis represents the number of students and the horizontal axis represents the days of the week. The graph depicts the attendance of boys and girls separately. 


 Grade 10 2021 Third Term Paper: Model answer for Bar Graph The above bar graph represents the result of a survey conducted among 100 Grade 11 students in a school. It shows the different ways they help their parents.


 The above 👆 module contains all types of test activities for Question - 6 of the OL English paper. It can easily be used as a handbook for classroom teaching or as a self-study guide.
 A model answer for the above Venn Diagram.
28) 💇Venn Diagram Activity. and Model answer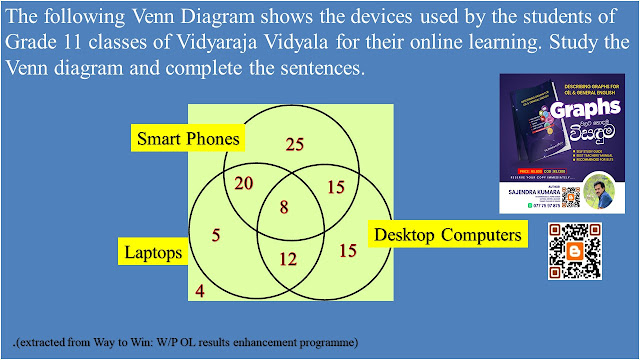
 The above Venn Diagram represents the devices used by the students of Grade 11 classes of Vidyaraja Vidyalaya for their online learning. The devices are Smart Phones , Desktop Computers and Laptops.


 The table given above represents five different extra curricular activities a group of boys and girls of Vidyaloka College participate. The first column represents the extra-curricular activities while the the second and third columns represent the number of boys and girls respectively.
 Model Answer
 The above bar chart represents the pets the Grade 11 students of Vidyaloka College like to keep. The vertical axis represents the number of students while the horizontal axis represents the different kinds of pets they like.
  The above Venn Diagram shows the pets a group of students in Grade 10 classes of Vidyaloka College like to keep. The animals cats, dogs and rabbits. The Venn Diagram represents 69 students.


Dear Readers,


OL 2016 : Model bar graph/ double bar graph.
The following bar graph shows the leisure activities of students of the Southern Province. Study the bar graph and write a description about it. Use the following words. Use about 100 words.

The bar graph given above represents the leisure activities of students of the Southern Province. The vertical axis represents the percentage of the students. The horizontal axis represents the leisure activities. There are four leisure activities. They are Chess , Tennis , Swimming and Cycling.
According to details given in the bar graph an almost equal percentage of the boys and girls like Swimming. Interestingly, the highest percentage of both boys and girls like Swimming. More girls like Tennis than Chess. A higher percentage of the boys like Cycling than girls.
By analyzing the details given in the bar graph I find that Swimming is the most popular activity among both boys and girls. Tennis is the least popular activity among boys. Chess is less popular among girls.
Activity 14 :
The following pie chart shows the percentage of students and their leisure time activities. Study the chart and write a description about it. The following words will help you.
(The majority / the highest percentage / the lowest percentage / equal )
According to the details given in the pie chart the majority of the students engage in browsing the internet during their leisure. It is 30%. The lowest percentage of the students engage in gardening. It is as low as 10%. An equal percentage of the students engage in reading story books and playing games. It is 15% each. More children watch TV than gardening.
As a whole, I can find that browsing the internet is the most favourite leisure time activity among the students. Most children do not like gardening.
Practice Describing Graphs
The contents of the book


The graph given here shows how the students of Grade 11 C class of Minidu Vidyalaya attended school in one week last month. Study the graph and write a passage. You may use the words given within brackets. Use around 100 words.
The bar chart given above depicts the attendance of school of Grade 11 C students of Minidu Vidyalaya in one week last month. The vertical axis represents the number of students and the horizontal axis represents the days of the week. The graph depicts the attendance of boys and girls separately.
According to the details given in the graph, the highest number of boys attended school on Tuesday. It was 20 boys. In contrast, the highest number of girls attended school on Wednesday. The attendance of girls on Thursday was slightly higher than that of the boys on the same day. The lowest number of boys attended school on Wednesday while that of girls attended school on Monday. The attendance of girls on Tuesday was equal to that of the boys on Wednesday.
As a whole I can say that more boys were interested in attending to school last week than girls.
Line Chart: Model
16) The line chart given here shows the population of five selected animal species in the Yala National Park. Study the chart and write a passage. 
👉17 Model Answer Western Province Grade 11 paper: 2021 Third Term

The pie chart given above represents six favourite subjects among the students of Galagedara M.V. The subjects are English, Science, History, Music, Mathematics and Sinhala.
According to the details given in the pie chart the highest percentage of the students like Mathematics. It stands at 29%. In contrast, the least percentage of the students like Music. It is as low as 5%. An equal percentage of the students like History and Sinhala. It is 10% each. Sinhala is less popular among the students than English.
As a whole I can find that Mathematics is the most popular subject among the students. Music is the least preferred subject among the students.
18
👉The Annual Rainfall: Line Chart (basic)

The line chart given above represents the annual rainfall in five districts. The horizontal axis shows the districts while the vertical axis shows the average rainfall received. The districts are Gampaha , Kaluthara , Nuwara Eliya , Hambanthota and Kandy.
According to the details given in the line chart the Kaluthara district receives the highest annual rainfall. It is as high as 2900mm. The lowest annual rainfall is recorded from the Hambanthota district. Interestingly, the Gampaha and the Nuwara Eliya districts record an equal rainfall. It is 2500mm each. The annual rainfall in the Kandy district is slightly higher than that of the Hambanthota district.
By analyzing the details given in the line chart , I can find that the Hambanthota district has a fairly dry climate.

19
OL 2020 Q:14 Model Answer : Bar Graph

Model answer 1- Sajendra
The bar graph given above illustrates the extra activities done by the Grade 10 students of Vidyaloka Vidyalaya to improve their English language skills. The vertical axis represents the number of students while the horizontal axis represents the activities. There are four activities. According to the details given in the bar graph the highest number of children watch films to improve their English language skills. It is as high as 40 students. An equal number of students engage in reading story books and singing songs. The least number of the students engage in making diary entries.
By analyzing the details given in the bar graph it is clearly seen that watching films is the most popular activity among the students. Making diary entries is less popular among the Grade 10 students.
20) Model bar graph activity

According to the details given in the bar graph the majority of the students help parents by scraping coconut. In contrast, the least number of the students help parents by cooking food and ironing clothes. An equal number of the students engage in them. More students help by sweeping than by washing clothes.
As a whole, I can find that the most favourite activity among them scrapping coconut.
Way to Win: Describing Bar Graphs (OL)
Worksheet 7
free download.
(😊For granting access it may take several hours)

21)
Way to Win: Worksheet
Model Answers for Bar Graph OL
Question:
The following bar graph shows the different sources of water used by the some families in a remote village. Study the graph and write a passage. Use around 100 words.


22) Way to Win : Model Answer for Bar Graph OL


23) Way to Win : Model answer for bar graph OL


24) Way to Win :Model Answer for Bar Graph OL


25) Way to Win: Model Answer OL ( Bar Graphs )


👱👱
WhatsApp your request (0777597875) if it is urgent for you to download.
It might take several hours or days to grant you access.
Sajendra Kumara
👉 Way to Win Part 10
Describing Venn Diagrams
26 ) Describing a Venn Diagram: OL


Model Answer| Venn Diagram | Favourite subjects
The above Venn Diagram shows the favourite subjects of Grade 11 classes in Vidyaloka College. The subjects are Mathematics , Science and History. The Venn Diagram represents 110 students.
According to the details given in the Venn Diagram the highest number of the students like Science. More students like Mathematics than History. Three students like all the three subjects. There are 17 students who like History only. Also 10 students do not like any of the given subjects. There are seven students who like Science and Mathematics only.
By analyzing the details given in the above Venn Diagram I can find that Science is the most favourite subject among the students.
Watch the Video on Describing Venn Diagrams: It is clear.
27) 👸 Venn Diagram Activity


The above given Venn Diagram illustrates the favourite board games among the Grade 6 students in Sangamitta Girls' College. There are three board games. They are carrom , chess and scrabble.
According to the details given in the Venn Diagram the highest number of the students like to play chess. 10 students like to play scrabble only. 12 students like to play all the three games. There are four students who like to play chess and carom only.
As a whole I can clearly find that chess is the most preferred game among the Grade 6 students of Sangamitta Girls' College.
28) 💇Venn Diagram Activity. and Model answer
(For further activities use Graphs Description Book)


According to given details of the Venn Diagram the majority of the students use Smart Phones only. 20 students use Smart phones and Laptops only. Eight students use all the three types of the devices. Four students do not use any of the given types of the devices. More students use Smart Phones than Laptops.
As a whole I can find that Smart Phones are the most favourite type of device used by the students for online learning.
29) 👩 Venn Diagram Activity


👇👇👇👇👇 click
30) From Sajendra's Grade 10 blog pageA bar graph description | Model Activity


31 ) Table Description : FOR OL


32) A double bar graph
For model answer click the link 👇👇

33) A graph description for OL : A table.
The table given here shows the different extra-curricular activities a group of boys and girls of Grade 11 classes of your school participate. Study the table and write a passage. You may use the words and phrases given within brackets.
[ the majority / more ... than / equal / the least / more interested in..]

According to the details given in the table, the majority of the boys participate in Cadetting while that of the girls participate in Clubs and Associations. The number of boys and girls who participate in Scouting and Clubs and Associations is equal. The least number of the boys participate in Clubs and Associations while that of the girls participate in Cadetting.
As a whole, I can clearly find that the boys are most interested in Cadetting while the girls are most interested in Clubs and Associations.
34) Horizontal Bar Graph description -OL 2023(2024)
Model Answer

The above bar chart shows the results of a survey conducted by the Vice Principal of Vidukirana Maha Vidyalaya on the reasons for Grade 11 students to be late to school. The chart carries five excuses.
According to the given details in the chart, the excuse given by the majority of the students was the rain in the morning. The excuse given by a few students was that they forgot to set the alarm clock. More students gave the excuse of headache or stomachache than buses stuck in the traffic. The excuse given by some students was that their family members got ill.
In a nutshell, it is clear that the reason for majority of the students to be late was the rain in the morning.
Horizontal Bar Graph OL 2023(24)
👉👨 To whom it may concern

I am writing this note with regard to the ambiguities that the 'bar chart test' of the OL English paper 2023(24) carries for the students.
First, ' a survey' is usually conducted to find out the cause or the causes for some issue in general. The reason included, 'rain in the morning' , stands contrary and it is something that would not occur often. On the other hand, the said 'reason' is also the excuse given by the highest number of students. It gives the notion that this particular survey has been conducted to find the reason for getting absent to school on some particular day. Further, another student could also conclude that the motive of the 'survey' was to find reasons for being late to school in general.
Therefore , the examiner does not clearly mention anything with this regard. He leaves the 'little ones' to guess 'anything'. The use of past tense 'verbs' in the given excuses is the only 'straw' that students could hang on to for their survival. I feel that the use of the word 'survey' should have been avoided to make the instructions more clear.
I do not challenge the examiners , but they need to focus more on the average student. A Credit Pass in English language could be a turning point in a student's life. You should come down to the grassroot level and be concerned of our 'young ones' already stressed due to undue delay in their exams. I hope that you would be humble enough to admit the lapse that occurred. However, the OL students of 2023 would never think good of you.
Do not forget the fact that the OL examination is ' a national level exam'. The content of the questions must apply to all the students in the island. Though, perhaps you may not know, there are hundreds and thousands of children who have never travelled on a train (Question number - 6) . And even the far reaching essay topics may suit only undergrads. (Question -16)
You also should think of our teachers, weather it is private or government , who always use their maximum energy to help their students.
Well, what is done cannot be undone. Hope this not would help you set at least the next year's paper with some standard.
Sajendra Kumara
A trained teacher of English
Marker and material writer
17/05/2024
Watch the above video for tips on describing horizontal bar graphs.
35 Model Horizontal Bar Graph for OL: Model Answer

The bar chart given above depicts the different places the Grade 11 students of Mr. Sajendra's English class prefer to visit on their annual excursion. The chart represents six places.
According to the details of the chart, the majority of the students prefer to visit Rumassala. In contrast, the least number of the students prefer Anuradhapura. An equal number of students prefer to visit Sigiriya and Yapahuwa. More students like to visit Haggala Flower Garden than Marble Beach.
As a whole, I can clearly see that Rumassala is the most preferred place among the students.
 The above 👆 module contains all types of test activities for Question - 6 of the OL English paper. It can easily be used as a handbook for classroom teaching or as a self-study guide.


36: Model Horizontal Bar Chart: OL / model answer

The above given bar chart represents the result of a survey conducted to find the different types of social media platforms the boys and the girls of Grade 12 classes of Vidyaloka College use. The vertical axis represents the types of social media platforms while the horizontal axis represents the number of students. There are four types of social media platforms.
According to the details given in the bar chart an equal highest number of both boys and girls use Youtube. Interestingly, more boys use Facebook than girls. The least number of the girls use Facebook and Instagram.
As a whole, Youtube is the most favourite social media platform among both boys and girls.
37: OL Graph description| ( Double )Bar chart  The bar graph given above shows the selection of aesthetics subjects for Advanced Level examination in Vdyaloka College, Paththalagedara in the year 2024. The graph illustrates the details of boys and girls separately.

According to the details given in the bar graph the majority of boys selected Dancing while that of girls selected Music. In contrast the the least number of girls selected Art while that of boys selected Drama and Theatre. An equal number of boys selected Art and Music. It stood 20 students each. Also more girls selected Dancing than Drama and Theatre.
In conclusion, I can clearly find that Music was the most preferred subject among the girls whereas that of boys was Dancing.
38: A bar chart description for OL| Model bar chart description.

According to the details given in the bar chart the highest number of the boys like to keep dogs while that of the girls like cats. The least number of the boys like cats. An equal number of the girls like to keep parrots and rabbits while that of the boys like rabbits and parrots. More boys like parrots than girls.
As a whole, I can clearly find that dogs are the most favourite pets among the boys while that of the girls are cats.
39 Venn Diagram | Model Answer for OL
39 Venn Diagram | Model Answer for OL

According to the details given in the Venn Diagram the highest number of the students like to keep dogs. More students like to keep cats than rabbits. 10 students like to keep cats only. There are two students who like to keep both rabbits and cats only. Five students like to keep all the three types of animals. There aren't any students who like to keep both rabbits and dogs only. Also three students do not like to keep any of the animals given here.
As a whole, I can clearly find that dogs are the most favourite animals among the students.
40 Next
40 Next
👧👧👧
Model English Activity Paper for Paper 1 (Paper - 3)Diagnostic Type Paper with 40 marks
Request on WhatsApp. (0777597875)
Click here for download
👇 CLICK HERE
OL RESULT ENHANCEMENT PAPERS 👉 to be continued....

Dear Readers,
Activity books with 100 model questions in each for OL students titled Steps to Brilliance Books 01 / 02 are available for sale. Contact Sajendra Kumara for details. 0777597875.


65 comments:
Describing a graph is an easy writing activity which need some practice. Hope to contribute more. Keep in touch.
an equal percentage of the children like or likes?
Good job sir thank you very much.
Thank-you so much for your support by publishing this
its very valuable for o/l students
Good
Thank for the this lesson...
Thank you so much.It is a great work.
it's wonderful ! the way you teach us
This questions are best
Good job sir...👍👍👍👍👍
Excellent
Very ninic and very imimportan.thank u very much
Very ninic and very imimportan.thank u very much
Good work .thanks
More explain
Thanks sir
Thanks sir
Good
Thanks sir.can you please add more answers on two bar graphs and ven diagrams.
Superb sir thanks a lot. 🙏🙏
Excellent work
very useful sir
Thanks
i need some more exercises with answers sir
Thanks. I hope to post more as and when I find time. I appreciate your encouraging words. All the best!
Sir how to write "the highest percentage of boys likes or the highest percentage of boys like"
Wooow....excellent ...this work should be appreciated highly ...it is very very important to all of us...keep up ur good work Mr.sajendara kumar....May the triple gem bless u!
thank you very much sir
the highest percentage of boys likes
Thank you sir
It is use full to me in ol exam. So i thank for you
Very usefull sir thank you for your useful information
Very excellent sir.
Thanks. Hope to contribute more. Keep in touch.
thanks
you
Thanks a lot sir
Keep in touch hope to add more activities with answers.
👍
Thank you Sir.It was really helpful and the way you descibe the graphs, pie charts, etc was very simple and can be easily understand
Easy writing tips.exellent sir.
Not only O/L students but also A/L students
thanks,sir very useful
Thanks for you sir. This is very useful for o/l students
👌
Thank for your dedication
Excellent
Thank you so much
this many usefull our. thank you sir.
It is very very helpful for me sir. Thank you so much.
Very glad to read your blog.Thank you for sharing this article.It is great! I will keep your article in my idea. Very happy reading.....
Maritime and Coastguard Agency UK approved courses
Thank u sir!!! very helpful.....
really helpful sir ! thank u very much sir ! <3
Thank you sir
Thank you sir
Great do more
Creating charts is really fun for me, Data visualizations help you tell a story by curating data in an easy-to-understand way and highlighting trends and outliers by using tools like Sankey Chart Maker, thereby unlocking the hidden insights in the available data
Thank you so much sir for you're help
Thank you sir
It's really helpful. Thank you very much sir!
Thank you sir. It's so helpful and useful
excellent job sir. thank you
Creating charts is really fun for me, Data visualizations help you tell a story by curating data in an easy-to-understand way and highlighting trends and outliers by using tools.
Very glad to read your blog.Thank you for sharing this article.It is great! I will keep your article in my idea. Very happy reading.....
I’m highly appreciating your work sir. Because, you gives lot of questions with best answer. As well it’s very easy for student who want to study about graphs and analysis. Well tried..
It' s really helpful sir. Thank you so much your support.
Post a Comment